In 1672, Newton is reprted to have written.... "In the beginning of the yeare 1666 I procured me a triangular glasse Prisme, to try therewith the celebrated phaenemena of Colours."
Newton wrote in Latin, the text is probably a translation to the English of the time. Newton's collected writings on optics were finally published in 1704 (He paid for the publication himself.) in a book called simply Optics.
In Newton's time (~1650-1700) the spectrum was well known. For a thousand years Indian astrologers had taught that white sunlight was composed of (8) colors. They associated the colors with gemstones; diamond (white), cat's eye, hessonite, coral, sapphire, pearl, emerald, yellow sapphire, and ruby.
In Europe, the somewhat bizarre view of Aristotle, that all colors were mixtures of black and white, had remained popular until the sixteenth century. Finally, in 1613, Francois de Aguilon got it more or less right. He held that there are three primary colors (red, yellow and blue) which, with black and white, can be combined to make all colors.
Since Newton's time, prisms of many types have become an essential component of optical instruments; telescopes, SLR cameras, etc.
Light is deviated (changes direction) as it passes through a prism.
|
|
As the prism is rotated the angle of deviation reduces, reaches a minimum, and then increases once more. The effect is best appreciated by watching a short video clip.
|
|
At minimum deviation light passes symmetrically through the prism. A little geometry leads at once to the relationship between the refractive index of the prism material (n), the angle of the prism (A), and the angle of minimum deviation (D).
Measuring angles of deviation from photographs allows the angle of deviation to be plotted against the angle of incidence for a 60° glass prism.
Calculation gives the refractive index of the glass from which the prism is made, with respect to air, as....
... allowing for a possible error in D of ±0.5°.
The prism is made from window glass.
The angle of minimum deviation can be found with two pieces of paper and two straight lines. A small high refractive index glass prism rests on the paper at the intersection of the lines. Adjustments are made until the prism is symmetrically placed w.r.t. the lines, and each line appears to continue through the prism when viewed from a point close to the paper.
Using this method the angle of minimum deviation is found to be 79.5 ± 0.5°. Calculation gives a refractive index of 1.67 ± 0.1.
Note: the high refractive index glass is highly reflective - it has a brighter appearance than a similar ordinary glass prism.
The image of the line in this prism is separated into colors much more than the same line seen in an ordinary glass prism. The lead glass is more dispersive. A black line is split into the secondary colors, cyan, magenta and yellow, not the red - green - blue spectrum seen when white light passes through a prism. A red ink line on white paper is split into the same three colors but the cyan is very faint.
Inverting the images in Adobe demonstrates the relationship between the primary and secondary colors.
Inverting the black line image gives red, green and blue.
Inverting the red line image gives green and blue.
A white light spectrum results if a white line is drawn on a black base.
Inverting the white line spectrum gives the secondary colors.
Explanations
The spectrum of the black line is formed in this way. The white paper reflects all colors. The black line reflects no light. Imagine the white background to be composed of the three primary colors red, green, and blue. The prism displaces the colors differently. The red background with a missing line is displaced the most. The green background is displaced less than the red but more than the blue. the spectrum is made up of three lines, cyan, magenta and yellow.
The red ink line reflects red. The situation is the same but the gap in the red background is missing. The result is a spectrum with just the magenta and yellow lines. In a real case red ink reflects a little less red than the white paper and a faint cyan line remains.
If you put a fish tank full of water or a slab of glass on a sheet of paper the print looks to be inside the water (or glasse etc.
It is relatively easy to show that the ratio of the real depth (d) over the apparent depth (d'), which is bigger than , is the refractive index of the water, glass etc.
> Proof
Example 1
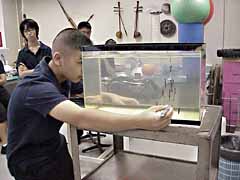
A group of students each peer in to the end of a fish tank full of murky water. The end of the tank (covered in black lines) appears to be relatively close.
Students reached down the side of the tank and placed a mark on the glass where they believed the end to be. They could not see their hand because of total internal reflection.
Data:
The marks on the tank were scattered in a normal distribution with a peak at 38 cm and a standard deviation of about 2 cm.
The refractive index of water was estimated to be approximately 1.32 by this method.
Example 2
A fish tank filled with water is shown as a schematic diagram at right. The apparent depth can be estimated and marked on the outside of the tank remarkably accurately by using both eyes (see binocular vision in the optics index). A more accurate measurement can then be made by leaving the marker in position and moving your head to use the method of no parallax. The refractive index is then found as the ratio d/d'.
Suppose a glass block is submerged in water. Remembering that the refractive index of the medium in air (n) is now replaced by the ratio n2/n1 we have the ratio d/d' equal to the ratio n2/n1.
Example 3
The prism shown is made from two-pot epoxy resin. Placing the prism on a printed page allows the apparent depth to be estimated by the method of no parallax and marked on the ground surface with a pencil. The points are joined with a line. The graph of real depth and apparent depth is plotted directly on the prism. The ratio is either determined directly and the refractive index calculated, or values can be entered into Logger Pro and the ratio found from the slope of the graph.
| A word to the wise: IB likes this one - learn the proof and make measurements of your own. |