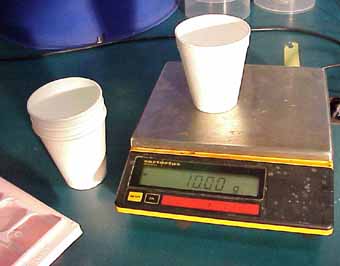
 Fig 3 - weighing an ice cube and cup with an electronic balance. |
Naoko Sekaeda: 2006
Introduction
In the first half of 2005 a huge iceberg
calved from the Ross Ice Shelf in Antarctica. Anxieties over climate
change and global warming made the event headline news. One prediction
had the huge berg - originally 160 km long, 30 km wide with an
edge wall 30 meters high - lasting from two to four years before
melting away completely. The initial mass can be found from the
surface area, the height of the wall and the densities of ice
and sea water. The rate of melting will depend on the sea temperature
and the surface area.
Research Question
What is the melt rate of ice cubes? How does it change as the
temperature of the surrounding water changes?
Hypothesis and Explanation
The melt rate will increases as an ice cube melts and its mass decreases because the temperature of an ice cube is less influenced when the mass is larger. The relationship between the time it takes an ice cube to melt and the temperature of water may be exponential because an ice cube will melt faster when the difference in temperatures with the surrounding water is larger.
Materials and procedure
This work was carried out with a water tank, ice cubes, paper cups, an electronic balance.
An ice cube was weighed and dropped into the water. The mass was measured every 30 seconds. by removing the ice from the water, placing it in a polystyrene cup and weighing it on an electronic balance. The process was done as quickly as possible to reduce errors due to melting out of the water.
|
Fig 3 - weighing an ice cube and cup with an electronic balance. |
The procedure was repeated three times at 18°C.
The melt rate of ice cubes was then measured at different water temperatures ranging from 4 to 24 degrees Celsius. The mass-time data was graphed in Logger Pro. The time taken for a 20 gram ice cube to melt to 5% of its original mass was found at each temperature and graphed against the temperature.
Data and Analysis
Three ice cubes were melted in water at 18°C. Mass and time
data are listed in table 1.
Table 1
The times taken to melt completely from were found to be 216, 170, and 197 seconds respectively.
The melt rates for the three ice cubes in 18°C water are plotted in Graph 1.
Averaging the three curves and using half the range as the error gives Graph 1a. The melt curve is smooth but the data is not a good fit to a log or an exponential function. The curve of best fit for the second half of the melting process is a Gaussian function. There is no particular significance associated with the use of this curve. The line is regarded merely as a good fit to the data points, and could have equally well been drawn by hand. As noted above there is some uncertainty (±20 seconds) associated with the time for complete melting. To get more consistent numbers the time for 95% of the original ice to melt from 20 grams has been found on this graph as 156±10 seconds . This measure of melt rate is used below, for the melt rates at different temperatures.
The ice cubes are approximately spherical. The surface area
is approximately given by the two thirds power of the mass. Graph 1b is a plot
of the approximate surface area of the ice against the time. An
exponential function g has been fitted to the data points but
within errors the area-time relationship is approximately a straight
line, showing that the melt rate is, within errors, proportional
to the surface area.
Melt rates at different water temperatures
Mass of ice cubes was measured every 30 seconds in different temperatures
of water. The data is listed in Table
2.
The data from Table 2 is plotted in Graph 2. Gaussian functions have been fitted to the data points. The melt rate of ice cubes were increased as the temperature of the water increased. The same formula was applied to the all sets of data. The melt rates were exponential. Since the data of mass below 1 gram shown in Graph 2 is not reliable, the times in which 95% of the original masses melted were measured. The 95% melt line is shown on the graph. These times are listed in Table 3 and are plotted against the temperature of the water in Graph 3. The 95% melt time is an exponential function of water temperature within errors.
Surface area versus 95% melting time
The approximate surface area was plotted against the time for melting in 18°C water in Graph 1b. It was not possible at that temperature to distinguish between a linear and an exponential fit and a straight line was fitted to the data. At lower temperatures (specifically at 4°C the mass time line is more curved (see Graph 2). Plotting the approximate surface area in contact with the ware in Graph 4 against the time for melting in water at 4°C gives a curved area-time line that is a good fit to an exponential function. It appears that in general the surface area versus time curves for ice cubes melting in water at different temperatures is an exponential function of time.
Discussion
The results of this study could be extrapolated to estimate
the melt rates of larger northern
ocean icebergs that are approximately spherical, provided only
that the temperature of the sea is known. Southern ocean icebergs
are more nearly laminar in shape. The melt rate is expected to
have the same dependence on the surface area exposed to the sea.
melt rates of larger northern
ocean icebergs that are approximately spherical, provided only
that the temperature of the sea is known. Southern ocean icebergs
are more nearly laminar in shape. The melt rate is expected to
have the same dependence on the surface area exposed to the sea.
Evaluation and suggestions for further work
Errors were introduced in this work because of the method of measuring the mass of the ice. Removing the ice by hand many times may have increased the melt rate slightly and water transferred to the polystyrene cup may have added a little to the measured mass. Both of these sources of error would be reduced if, in future work a larger blocks of ice (~10 kg) were used in a swimming pool. If the ice blocks had ropes frozen into them when made, it would be relatively easy to remove them at intervals and to weight them with a calibrated spring balance. More accurate mass-time and area-time curves could be obtained in this way. In spite of these considerations clear relationships have been established in this work with reliable data. Both the 95% melt time versus temperature curve and the surface area versus time curve have been shown to follow exponential functions.
This work focused on the influence of surrounding water temperature only. Further experiments could be done ti investigate the influence of salt content (probably a very effect if any) and the effect of stirring the water. [Icebergs drift with the currents, but any turbulence and/or local current gradients would assist convection as a mechanism for carrying heat away and may affect the melt rate significantly.]
This study used ice cubes that are approximately spherical. A future study could be done with sheets of ice to model southern ocean icebergs - one of which was the initial reason for investigating melt rates.