Index
Grade inflation - a cautionary
tale
It is difficult to translate IB assessment which is examination based and norm referenced, [a raw exam mark of 75% is an A grade and 45% is a C], with a US style contiuous grading system, with marks confined to the upper ranges. ALL SHALL HAVE PRIZES outlines the problem of Grade inflation in the US in a rather dramatic fashion. It is filed here without alteration for easy reference. The original was printed in the Economist on April 14, 2001. Grade inflation is a factor that must be considered carefully by all institutions world-wide. There are arguments on both sides.We do our best; any suggestions will be welcomed.
A note on Rigor
.....
IB Internal Assessment. 
IB examiners have interesting things to say.
The range of work submitted
About half the work sampled from many schools around the world represents, well suited, richly diverse, scientifically sound, practical programs in physics, but a few schools still make use of fill-in-the-blanks work sheets. This does not challenge the student, and gives a wrong image of what physics investigations are about. Work sheets are not appropriate for most of the IB internal assessment criteria.
The use of computers
Students must be in control of any technology they use. A graphing program may return a slope to six figures but this does not account for uncertainties, the minimum and maximum slopes allowed by the data. Many students put error bars on graphs but rarely have the errors shown on the graph been carried through a calculation. Evidence of error propagation is essential if a final result is to be expressed correctly. It is pleasing to see that increasing numbers of students are determining the uncertainty in the slope of a line by manually fitting extreme lines. Care must be taken to include only the appropriate number of significant figures in tables and in computer generated panels on graphs.
Candidate performance against each criterion
The assessment criteria for data Collection, data Analysis, and evaluation are believed to be clear and straight forward, but many students do not understand what is meant by planning and evaluation.
A student has no opportunity to earn top marks unless there is scope to form a research question, express a hypothesis [which may equally prove to have been right or wrong] and to investigate the question systematically with appropriate equipment and the proper control of variables.
Developing an hypothesis
Research reports in physics journals and communications in the adult academic community rarely have an explicitly stated hypothesis. IB requires one - they deduct marks if it is missing. Just do what they want. An hypothesis is an educated guess based on prior knowledge. The hypothesis is not plucked out of the air - but is based on previous work, or an existing understanding of the world. Write down one clear hypotheseis, and justify your suggestion on the basis of what you know or have read.
Example:
A student is firing small balls of the same size but of different densities at a pad of clay with a catapult. The research question asks for the relationship between the depth of the hole and the mass of the ball.
"The bigger the ball the deeper the hole" ... is not a good hypothesis.
The depth of the hole will depend on the work done on the clay by the ball. If the kinetic energy of the ball is the same for each (because the catapult is stretched the same amount each time) the work done on the clay will be the same (provided the percentage of kinetic energy converted to heat in each collision is the same for each ball). If the two assumptions are correct ... The depth of the hole will be independent of the density of the ball.
The second alternative is a good hypothesis - supported by an argument and testable by measurement. The fact that the hypothesis will prove to be unsupported by the measurements is inconsequential. [The assumption of equal kinetic energies is not correct. The catapult does more work on the heavier balls.]
In many IB labs the hypothesis can be based on the referenced work of a previous student, who made similar measurements in a related area. See the Papers Index.
Data
Sufficient data must be collected to answer the research question. All graphs must have at least 6-7 data points. Sufficient trials must be done to determine random errors. Often just one set of five values for one particular setting in the middle of the range will be enough, but not always. All graphs require error bars. Error bars on graphs must match the errors listed in the tables.
For IB reports include tables of raw data (with errors) so that the reader can check your calculations and plot additional graphs. (In most papers in the literature raw data is not included. Don't argue, just do what they want.)
Analysis
Tables must be well set out, clear and easy to follow. The moderator will read the numbers! The columns must be labeled, with units, and the significant figures must be appropriate. An error is stated in the panel at the top of a table (as ± 0.2 for example) unless errors change from row to row. Include a sample calculation or determination of error.
Graphing programs may give tables with four significant figures. The student is responsible for the table and must reduce the number of figures to the correct level before submitting the final figure.
The computer generated calculation panel on a graph may have five figures in the values for slope etc. It is the student's responsibility to reduce the figures to the correct level in a final figure. The moderator will read the panel - the student is responsible for what is there.
The axes on the graph have been separately labeled in Photoshop. The panels have been edited in Photoshop to leave only the relevant data with the appropriate number of significant figures. The graph provides both a visual display of data with random errors, and appropriate calculations.
Note: error bars on graphs should be done by the student not selected at random. Logger Pro will let you put in a table of errors, select a fixed value, or a fixed percentage. Tell the reader (moderator) what you decided to do and why.
If a graph involves calculation in Logger Pro errors can be carried through the calculations by entering maximum and minimum points in the original data columns ... or the student can put in an extra column and calculate the error by typing in an equation, with data ± the error, and subtracting the new value calculated (the maximum possible value given the errors) from the original, using the difference as an error column. [ASK YOUR TEACHER TO SHOW YOU HOW TO DO THIS]. If a student prefers, they can do an error calculation by hand, write the calculation into their report, and use the result as either a fixed error or a percentage error, whichever is more appropriate. The IB examiner does not mind what a student does, provided they do something themselves that gives appropriate errors, they write down what they did, and they plot the errors on the graph.
The error in a slope or a constant is found from a graph with extreme lines or curves. Use manual fits and exercise judgment. Delete the error calculation in the panel on the graph and adjust the significance figures.
Note: there are marks for data processing. Students should select topics that allow them to demonstrate that they can process data. ie. Calculate and propagate errors. Fit relationships. Obtain a second graph with a linear fit. Find errors in the slope of linear graphs, with extreme lines. Construct graphs in a way that aids interpretation. The less time a reader needs to understand exactly what has been done, and what has been shown, the better.
Discussion
The discussion summarizes findings and relates them to the original hypothesis.
Do not use the awful verb hypothesized. The only time the word hypothesis is mentioned is in the heading. In the text, write ... is expected ... and was expected. A discussion may include applications and/or speculations. Make sure speculations are identified as such.
Evaluation
The strengths and limitations of the procedures (and apparatus) are discussed and possible modifications are suggested. Try to be specific. More quantitative evaluations are needed. Include a suggestions for further work section to assist students who will follow you.
Topics
Appropriate areas of interest within which a research question could be formulated.
- Some specific property of a bouncing ball.
- How some factor affects the terminal velocity of a falling object.
- The effect of incident light on the colors seen in a thin film.
- The effects of usage on the properties of dry cells.
- Some specific property of a vortex fired from an air cannon..
- The effect of different containers on a determination of specific heat by the method of mixtures.
- Some specific property of waves on water.
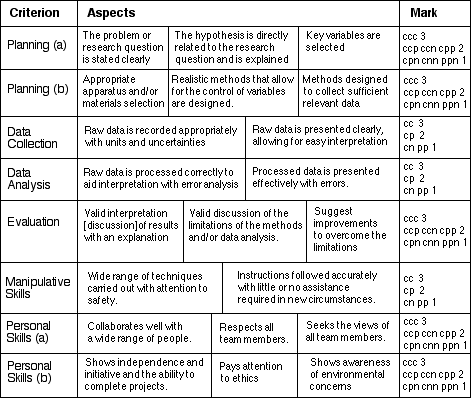
Assessment Criteria
IB Group 4 Internal Assessment Criteria [2004-] are summarized in the table below. To obtain the highest mark for internal assessment a student must consistently demonstrate all aspects of each criterion. In Physics at ISB, two complete papers will be selected to represent the student's best work. Different criteria will not be graded for assessment from many different reports.