|
Direct vision prism 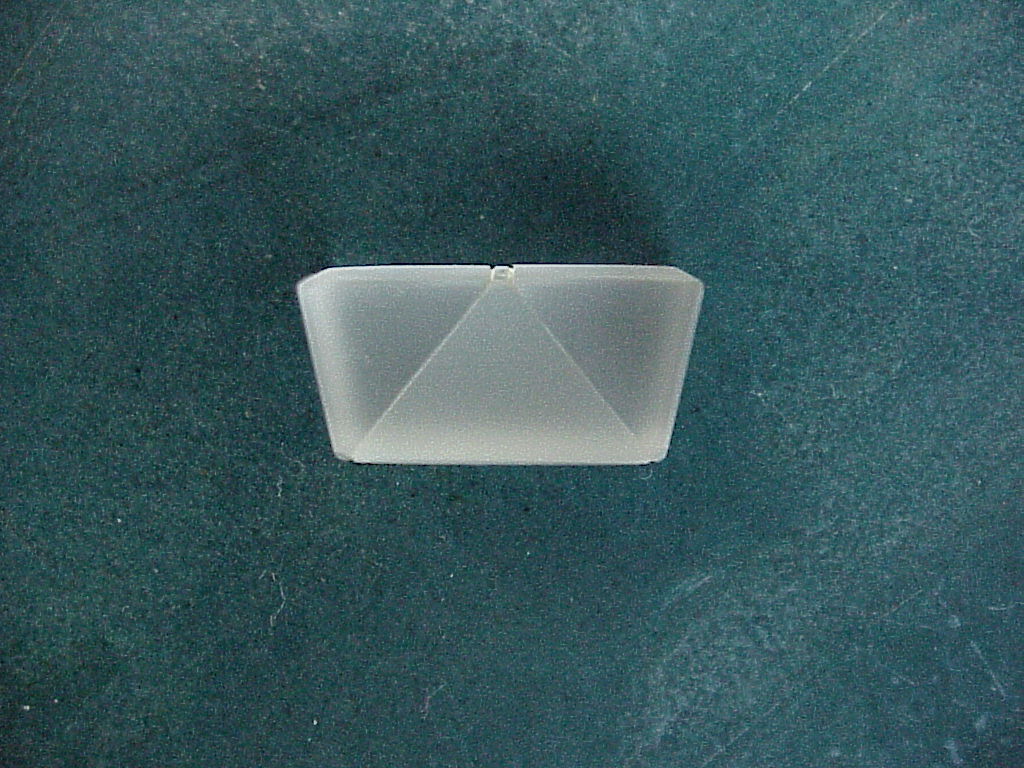 |
Amy Smith, Annie Sethiwan: 2004
Spectra will be photographed and examined to compare the images with the colors actually seen with the naked eye.
Hypothesis
The color spectrum, as seen by the naked eye, can be
photographed using a digital camera.
Explanation
An image on a computer screen is formed with the additive color system. For this reason, it is possible to accurately reproduce the appearence of the spectrum using a digital camera, assuming that the camera is equally sensitive across the visible spectrum and that the phosphors used are monochromatic, red, green and blue. These two qualifying assumptions may not be valid in a real case.
Methods
The objective of this first part is to check whether or not a digital camera captures a full color image. First, a direct vision prism was selected for the process.
|
Direct vision prism |
A direct vision prism separates white light into its full color spectrum. All the energy is concentrated in one spectrum, rather than the array of different spectrums formed by a grating. The prism (shown above natural size) is made out of three joined prisms: the two end pieces have a refractive index of 1.5 and the middle section has a refractive index of 1.76. Since the face of the prism is only 1.4 cm wide, the lens of a standard digital camera is too wide for the prism to cover This problem was overcome by using the Casio Exilim digital camera. The prism covers the lens of the camera. The prism was inserted into a case made from black card to block out interference from other light sources. This case was fitted over the corner of the camera as shown in the lower photograph.
A fluorescent light, and a line filament bulb, were chosen as sources.
|
The fluorescent light 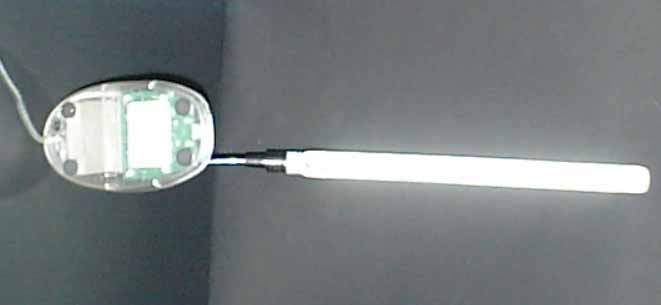 |
The two spectra are shown below. The colors appear as they do to the naked eye with the exception of the violet which is absent. There are two contributing reasons. The violet is less pronounced on the spectrum ofa filament bulb with a black body temperature of 3000 °C than it is in sunlight with a black body temperature of 6000 °C, and the CCD chip in the digital camera is less sensitive int he violet.
| Spectra |
|
Filament bulb |
|
Fluorescent tube |
Question
How do different coloured strips placed on different backgrounds appear when viewed through a direct vision prism?
Hypothesis
On a black background it is expected that viewing the different
coloured strips with the prism will produce the spectral colours
that are combined to make up the color of the strip.
On a white background it is expected that the dispersed spectrum
will be made up of secondary colours complementary to the primary
colours that are seen with the black background.
Explanation
When a white strip on a black background is viewed through a prism,
a spectrum of primary colours Red, Green and Blue is seen. White
is a combination of those three primary colours. When a back strip
is placed on a white background, a spectrum of secondary colours
Cyan, Magenta and Yellow is formed. From this we expect the colour
spectrum formed by different coloured strips to be in relation
to the models. A Red line on black card for example will result
in a spectrum of Red only, because the red strip is made up of
a single primary colour. Applying the model we expect the spectrum
formed when viewing the same Red line on a white background to
be made up of Cyan only.
Procedure
Strips of colored paper will be photographed against black
and white backgrounds. The images will be inverted in Photoshop
to determine whether the additive and subtractive color systems
adequately account for the effects.
The optimum width of the strips was determined by pasting different
width strips to the two backgrounds and viewing them through the
prism with the naked eye. The most appropriate size was about
one cm wide. The optimum viewing distance (1.5 meters) was found
by walking back and forth while looking at the strips through
the prism, looking for the distance that produced the clearest
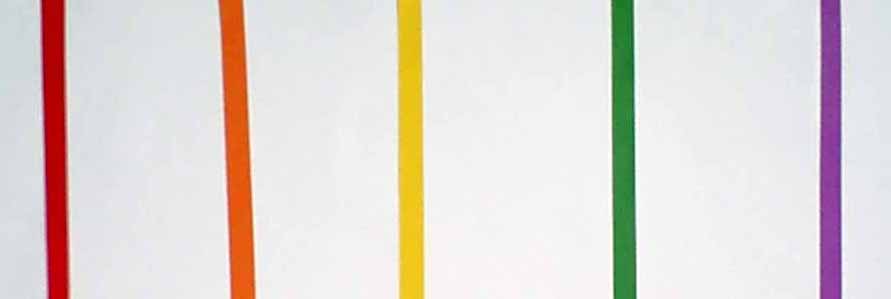
images. Poster card, strips of Red, Orange, Yellow, Green and
Purple were glued on to the background colours of white and black.
The arrangement is shown at right.
|
The colored strips
|
Data
Taking photos of the spectrum involved simply placing the coloured strips out in the sun to receive maximum light. With the prism over the lens the image on the viewing screen of the camera displayed the dispersed spectrum. Images on each background were taken and then transferred to Photo Shop for manipulation and analysis.
The strips photographed on both backgrounds
Analysis
Images on the Black Background:
In the first image the Red strip as expected appears to be primarily
a single strip of Red. However there are also faint traces of
both Green and Blue visible.
For the orange strip prominent bands of Red, Orange, Yellow and
Green.
The Yellow strip produces a spectrum of bright Red, Yellow and
Green.
The Spectrum formed by the green strip is prominently Green, and
like the red strip faint traces of both Red and Blue are visible.
The purple strip resulted in a spectrum of Red, a faint line of
Green and a much larger, stronger line of Blue than other strips.
The fainter strips of colour visible in all the images are
the result of impurities in the colour of the card used. The Red
spectrum on the Black background for example shows faint traces
of Green and Blue, which are in fact caused by the red card not
being a pure colour.
The dispersion effect viewed when the strips were placed on the
Black card appears to be predominantly spectrums of the primary
colours that make up the strip. This effect can be explained by
looking at the reflections and absorptions that take place by
both the strips of card and the background card. Looking at the
red strip as an example once again, we know that the Red strip
reflects red light and absorbs the Green and Blue light. The Black
background absorbs all light, therefore the only colour that is
being reflected from both backgrounds is that of red and there
is an absence of all other colours. The result is a dispersion
of red light only, viewed as a single strip of red through the
direct vision prism.
The effect observed on the White card can be explained by the
following. The Red strip reflects red light and absorbs Green
and Blue, while the white card reflects all colours of light.
Assume that the white is made up of the three primary colours
Red, Green and Blue. The effect is somewhat like a subtraction
as the Red strip is subtracting the Green and blue light that
the white card reflects. This results in an absence of Green and
Blue. Therefore instead of the colours usually dispersed
Red + Blue = Magenta
Red + Green = Yellow
Blue + Green = Cyan
The following combinations are viewed.
Red + Blue = Magenta
Red + Green = Yellow
The colour Green is replaced with Magenta, the absence of Green,
and Blue is replaced with Yellow. The diagram shows panels of the three primary
colours which make up the emission from the white background.
The white lines signifying an absence of colour and the filled
lines the reflection. The prism disperses the three primary colors
of the white background different amounts. The three lines can
be represented by the panels in the diagram. Line one is the combination
of Red Green and Blue, resulting in white. Line 2 is a combination
of Red and Blue, resulting in Yellow. Line 3 is a combination
of Red and Green resulting in Magenta.
The same explanation applies for all the different coloured strips
by looking at what colours are being reflected by the strip, and
what colours are being reflected by the background colour (white).
Another effect noticed is that when the strips are viewed on the
white background, the spectrums formed for the Green and Purple
strips appear to be identical. This suggests that these two colours
are in fact complementary to each other. Inversion in Adobe
makes this clear.
Inverted image
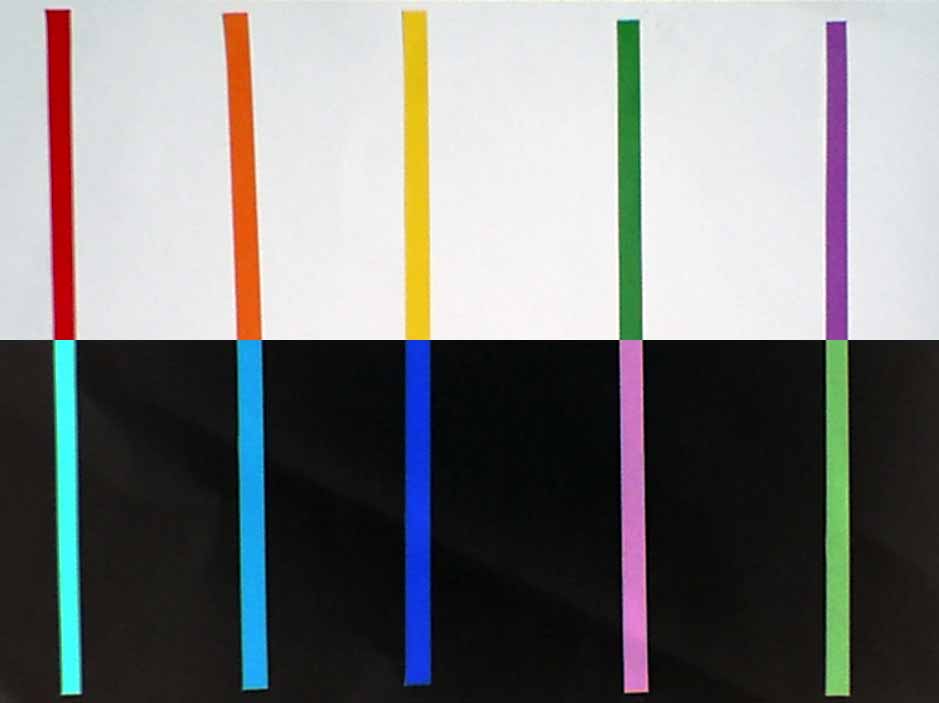
Paper strips on a white background with inversion below.
As expected the two colours, green and purple are complementary colours, because when inverted each produces the other. The colours Red, Orange and Yellow also appear to have a relationship. When inverted all appear a different shade of blue, suggesting that the component primary colours that make up these colours are similar in all three colours.
Evaluation
The results obtained were for the different coloured strips on
the Black background were as expected. Each strip produced a spectrum
of its composite primary colours, as proved by the explanation
for the Red strip. The Red strip is made up of the primary colour
Red only, hence the single Red strip that was viewed through the
Direct Vision prism. The Green strip also produces one thick band
of Green. Perhaps a Blue strip should also have been used so that
the three primary colours were all viewed, providing a definite
example for the explanation.
However when the strips were viewed on the White background the
effect was not as expected. Instead of producing a spectrum showing
the complementary colour of that viewed on the black background
spectrum, a subtraction effect was discovered. The combination
of absorptions and reflections of light from both the Strip and
the white background resulted in a spectrum of complementary colours
of those primary colours not produced on the black background.
Sources of error or uncertainty come form two major sources. The
first, already mentioned in the analysis section, is that the
strips were not pure colours. Because traces of other colours
existed in the strip, faint lines of colour could be viewed in
some of the spectra, for example very faint lines of Green and
Blue could be seen when the Red strip was viewed on the Black
background, causing a faint line of Cyan to be visible on the
White background. This impurity however was assumed to have no
effect on the final analysis and explanation and the faint traces
of colour were not factored into the effects. Obtaining high quality
card would eliminate this limitation and would result in spectrums
of only the colours described in the explanations.
The second source of uncertainty is the inability to reproduce
colours completely accurately through photographing. When photographed,
then viewed in the screen and further reproduced through printing,
there is a slight distortion in the colours, however the effect
this would have on this experiment is very minimal as we are not
interested in the shades of the colour as much as their presence.
By placing the photographs in Adobe Photoshop we have altered
the brightness and contrast minimizing the limitation posed by
photographing.