Data and diagrams from:
Jennifer Dickerson: 2005
Research Question
What is the relationship between the angle of the ramp and the acceleration of a ball rolling down that ramp?
Hypothesis
In preliminary trials it was noted that the larger the angle
of the ramp the faster the ball rolled. A note on the web gives the relationship between
acceleration (a) and ramp angle (a)
as...
a = g sina
... where g is 9.81 m/s/s.
It is expected that this relationship will be confirmed by these measurements.
Materials/Procedure
The independent variable in this experiment is the angle of the ramp. The dependent variable is the acceleration of the ball.
The same steel ball (4 cm diameter) and long (1.7 m) ramp were
used in each trial. The angle was varied by changing the number
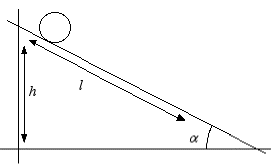
of books supporting the upper end of the ramp (see figures 1 and 2).
A meter stick was used to measure the length
of the ramp (1.00 m) from the red point to the blue point and
the height from the red point to the table top (the yellow point).
The ramp was a metal "U" shaped channel 2 cm wide. To ensure
consistency for each trial the ramp placement was marked with
tape and a book was placed at the end of the ramp to hold it in
place.
Three separate trials were performed at each height. The data rate was set at 20/s for the first three (low angle) trials and at 50/s for the later trials with larger values of alpha. The derivative calculation, to find the velocity from the position data, was set to average over five points. The ball was released from the same position each time and velocity-time graphs were plotted with heights (one meter from the lower end) ranging from 5 cm to 65 cm.
Data Collection
Data is listed in Table 1.
Data Analysis:
Sample Calculations:
Finding error for the sine of the angle:
Finding the Angle:
Finding the acceleration from a graph:
Graph 1 is a
sample calculation showing how the acceleration was determined
with a linear fit on the velocity versus time graph. The constant
acceleration of the ball traveling down the ramp is 2.13 m/s/s.
In table 2 the data
is listed with the errors for each average and angle. The errors
in the accelerations are the Average Deviations.
Graph 2 shows the relationship between Acceleration and sina. The errors shown are listed in Table 1. Acceleration appears to be proportional to sina but the errors shown are unrealistic. Adding more realistic error bars and two extreme lines makes it clear that the acceleration is proportional to sina but the slope of the line is....
... not 9.8 (g) as expected.
Discussion
Graph 2 is a straight line through the origin, if the errors in acceleration listed in Table 1 are less than the actual uncertainties, but the slope of the graph is clearly not close to 9.8 m/s/s. The relationship quoted above was taken from student work on the web and appears to be incorrect.
The low value of the constant could be due to the rotation of the ball. The relationship a = g sina is derived for a mass sliding on a frictionless incline. The ball is rolling, and will gain both translational and rotational kinetic energy. The acceleration will be less than that of a sliding mass.
It can be shown that for a uniform spherical ball, rolling without slipping or rolling friction, on an incline of angle a, is given by....
The measured constant (6.6 ± 0.4 m/s/s) is a little low, but is in general agreement with this prediction. The discrepancy could be accounted for by noting that the ball does not roll on a flat surface but in a groove. The linear velocity v will not be exactly equal to rw as assumed, and a larger percentage of potential energy will be converted to kinetic energy of rotation than is indicated in the theory panel.
Evaluation:
The random errors in the acceleration values listed in table 1 appear to have been underestimated. Additional uncertainties, inferred and shown as red error bars in Graph 2a, may be due to the insecure nature of the setup. Fixing the ramp in position with a clamp-stand may improve accuracy.
It has been assumed (Graph 2) that the small errors in the middle of the sampled range were fortuitous. If there are two sources of error - one more important for low angles and the second more important for larger angles then this may not be the case. More data is required before any definitive comment could be made.
The data in Graph 2a is consistent with a sina relationship but the data is not accurate enough to distinguish between a sina and a linear relationship. Graph 3 shows a linear fit to a plot of acceleration against angle. No error bars are shown on this graph since the estimated errors in table 2 have been shown to be less than the actual errors. For small angles theta and sine theta are almost equal.
More measurements, under more carefully controlled conditions, with large ramp angles are required to determine whether or not the acceleration is strictly proportional to sina.
A cautionary tale
The web reference, giving the acceleration versus angle relationship as....
... looks reliable but clearly, it is not. Take care with the web - students (and others) often put up nonsense, without proper peer review.
The hypothesis, based on a false assumption, was not supported. For assessment purposes, it is important to state clearly what the data indicates, but an hypothesis may or may not be supported.