Predicted range vs. measured range |
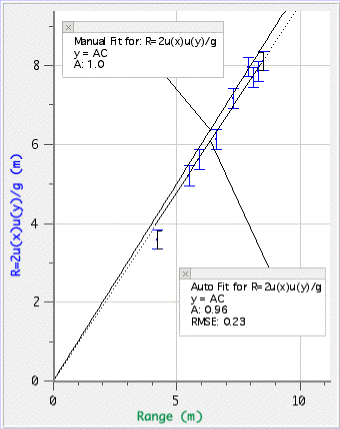 |
| Graph 3 - if the predicted and measured ranges were identical the slope of the line of best fit would be 1.0. |
Predicted range vs. measured range |
|
|
| Graph 3 - if the predicted and measured ranges were identical the slope of the line of best fit would be 1.0. |