Kaminsky, Paulina 2000
A conical pendulum is driven by holding the string and
making small circular hand movements. If the circular motion of
the ball is detected, with a moton detector, ande the lateral
centripetal force is measured with a force probe, the relationship....
... can be confirmed.
Data
The position-time graph is similar in appearance to the velocity-time graph and to the force-time graph.
Analysis
The data was analyzed and graphed as for Trial 2 (see below). The data points did not form a straight line within errors on the measured-force versus calculated centripetal force graph. Closer inspection of the force-time graph showed what appeared to be small shifts in the apparent zero of force. The data was rejected for this reason and the initial analysis and graphs were also discarded. Several more sets of force-time data were obtained. The apparent zero on the force graph appeared to shift more on some graphs than others. Since force probe measurements had been stable in other applications it was suspected that the shifting zero had something to do with hand-holding the force probe.
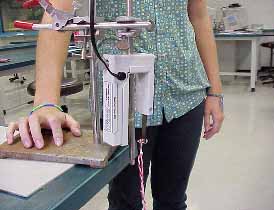
The force probe was tested for the effect of a rotation of the probe forward and backward. As shown in the graph at right the zero line was shifted. This discovery lead to a modification of the method. The force probe was attached to a stand (below), so that no movements were made and the tongue remained accurately vertical at all times.
The ball was swung at different speeds to get different velocity, force and distance measurements.
Data
The position-time graph is similar in appearance to the velocity-time graph and to the force-time graph.
Analysis
The data was exported from Mac Motion to Graphical Analysis, where measurements of maximum distance and force were chosen. These were then put back into Mac Motion where the radius and measured force were calculated by subtracting the zero line seen on the graph.
Using these values the centripetal force was calculated. This was compared with the measured force.
A straight line was found within errors but the slope was not +1.00 as expected.
On closer a inspection of the data points chosen in Graphical Analysis, it was discovered that the maximum velocity did not correspond to the maximum force. The reason being that the moton detector was not quite in position 1 as shown in the conical pendulum diagram 1.
The data points were
modified by including the actual measured maximum velocity
in the table, and a second
graph was plotted. The modification of the data made the graph
more straight, but the slope of the graph was still not +1.00.
It might have been due to the force probe calibration being wrong
or the ball might have been to big. If the ball is too big, the
measurement of the velocity will be incorrect. The ball used had
a diameter of
22 cm.
The experiment was repeated using a smaller ball, as it was suspected that the ball was to big for the collection of accurate data. The new ball had a diameter of 8 cm.
Data
The position-time graph is similar in appearance to the velocity-time graph and to the force-time graph.
Analysis
The data was again exported to graphical analysis. Points from the data were picked, that had maximum velocity, distance and force. This time there were fewer points since the ball was swung only at four different speeds.
The chosen data in the table was pasted into Mac Motion again and the measured force, radius and calculated force were found. Then a graph was plotted to see if the measured force corresponded to the calculated centripetal force.
Discussion
A straight line was found within errors, which showed that the force measured with the force probe did correspond to the centripetal force calculated using the motion detector data. The slope was still not quite what it was expected to be [that is, a slope of +1.00] but the slope was closer to 1.00 then the previous graph from the last trail. This means that the size of the ball probably did affect the results.
Suggestions for future work:
The experiment could be repeated using more data points and a much longer string to reduce errors. Also the calibration of the force probe could be checked, since the force probe in this experiment was positioned vertically and not horizontally, this may have affected the results. The measurements of radius and of velocity could be made with two separate distance probes and averaged to remove uncertainties due to the motion of the ball being slightly elliptical.
If a heavy ball on a long rubber band was swung at different angles, the tension in the rubber band could be found from the extension, measured on a video. Video analysis would allow the velocity to be measured. This method would be more direct, and may give more accurate data.