Jeong Min Lee, Wan Nee Chang: 2007
Abstract
The drag force on a polystyrene ball in circular is found to be
proportional to velocity to the power of 2, to within ±10%.
Introduction
Drag force is the resistance when an object moves through a fluid.
For a falling object, the drag force equals the weight (mg)
at terminal velocity. At other velocities, some other way must
be found to measure the drag force.
In turbulent flow drag depends on the density of the fluid, the square of the velocity and the cross sectional area. The drag coefficient, is a dimensionless number that depends on the size, shape, surface texture and orientation of an object. In turbulent flow the drag coefficient is defined as....
ie. the drag force, divided by the density of the fluid, times the frontal area, times one half the velocity squared.
Depending on the roughness of the surface, the velocity, and the viscosity, an object can pas through a fluid with laminar or turbulent flow. Laminar flow has a regular layered pattern. In turbulent flow the fluid breaks up into a series of complex and unsteady eddies. By using Reynolds number, the ratio of inertial forces to viscous forces in the fluid flow system, it is possible to predict whether laminar or turbulent flow will result in a particular situation. Reynolds number is given for a sphere by Re = rdv/h, where r is the fluid density, d is the diameter of the sphere, v is the (terminal) velocity and h. is the viscosity of the fluid. When Reynolds number is above 1000 turbulent flow occurs. When it is less than 1 the flow is usually laminar.
Research Question
What is the relationship between the drag force and velocity when
a polystyrene ball in driven circular motion, and what is the
drag coefficient?
Hypothesis
The drag force on a 10 cm diameter polystyrene ball is expected
to be a proportional to velocity squared, and the drag coefficient
is expected to be greater than 0.5.
Explanation
Reynolds number is given for a sphere by ...
The viscosity of air at STP is 1.83x10⁻⁵ Nsm-2. The density of air is ~1.26 kg/m3. The polystyrene ball has a diameter of ~10 cm and a velocity of ~ 5 m/s. Reynolds number is given by ...
Turbulent flow typically occurs when Re is above 1000 and laminar flow is usually established when Re is less than 1.
At the relatively high velocity of driven circular motion (5 m/s) the ball is expected to move through the air with turbulent flow for which the drag force is proportional to velocity squared. The drag coefficient for a smooth sphere is 0.50. Because the polystyrene ball is not smooth, it is expected that more drag will be created and the drag coefficient will be increased.
Procedure
A string was attached to a 10.5 cm diameter polystyrene ball. The string was marked at 0.53 meters to keep the radius of the swing consistent when driving the ball in a circle. A 40 cm diameter circle was drawn and fixed to the ceiling directly above the swing to make sure that the diameter of the hand swing was constant. A 10-gram washer was added to the string to make a combined mass with the polystyrene ball of 11.75 grams. This helped to make the driving circle large enough to measure the lead angle between the radius vector and the string,, but small enough to avoid large errors. While one person was swinging the ball, the other person stood on top of the table to record the circular swing with a digital camera at 30 frames per second. The axis of the digital camera was held perpendicular to the floor, directly above the swinging motion. The ball was swung while lying down on the floor to avoid the effects of gravity on the speed of the ball and to keep the swing as flat as possible. The person swinging the ball tried to ensure that the motion driving the swing was a circle, by following the outline of the circular diagram fixed on the ceiling. This process was repeated eight times at different orbital speeds.
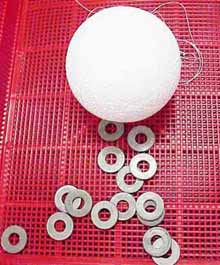 Fig 2 - the polystyrene ball with washers to increase the mass |
The velocity of each swing was found by importing the QuickTime movies into Logger Pro. Three methods were used to calculate the velocity to determine the errors.
1 A semi-circle of ball positions was plotted on the video clip (figure 1) , and the distance the ball traveled, pr, was divided by the time it took to travel that semi-circle.
2 An x-y position-time graph was plotted and a straight line was fitted to determine the maximum slopes of the graphs in meters per second.
3 A velocity-time graph was plotted in Logger Pro and a sine curve was fitted manually to determine the amplitude of the graph (Graph 2).
Methods 2 and 3 gave the same velocity within errors. Method 1 was tedious to apply and less accurate. Method 2 was the most convenient, and was used to find the speeds. The speed, centripetal force, lead angle, and drag force for all eight trials are listed in table 1.
The formula mv2/r was used to calculate the centripetal force for the circular motions, where m was the mass of the polystyrene ball and the washer in kilograms, and r was the radius of the circular motion in meters. Since the ball was very nearly in the same plane as the hand driving the motion, the radius was taken as 0.53 meters, the length of the string. The centripetal force and the drag force (tangential component of the tension) were found,
Logger Pro was used to plot the positions of both the Polystyrene ball and the hand in circular motion for each swing (figure 3). The images were captured using Snapz Pro and reopened in Adobe Photoshop to draw the vector diagrams. The lead angles between the radius and string vectors were found within ± 0.5° from the vector diagrams. The drag force, the tangential component of the tension force were then calculated.
The drag force in Newtons listed in table 1 is equal and opposite to the calculated tangential component of the tension, since the speed of the ball is constant. The drag force-velocity graph was plotted in Logger Pro (Graph 3). A power law with an exponent of 2 has been fitted to the data points to show that drag force was proportional to velocity squared.
A drag-velocity squared graph has been plotted. A straight line has been fitted to the data points. To determine the possible error in the slope, extreme lines have been fitted. Drag is proportional to velocity squared within ±5%.
The formula ...
... was used to determine the drag coefficient for the polystyrene
ball in circular motion. The calculated coefficients are listed
in table 2.
Table 2
The calculated drag coefficients for the polystyrene ball traveling through air over a range of speeds are listed in table 2. The drag coefficient is 0.70 within ±10% and is not dependent of speed between 4 and 8 m/s.
As expected, the drag-velocity graph shows that the drag force acting on the polystyrene ball is proportional to velocity squared (within errors of ±10%). The drag coefficient for the polystyrene ball was expected to be greater than 0.5, the value for a smooth sphere. The measured value (0.70 ± 0.05) is consistent with this expectation, but in other work it has been found that the drag coefficient for polystyrene balls falling at terminal velocity (~ 5 m/s) is 0.50±0.05. It is suggested that the higher value found here is not due to the roughness of the ball but is due to the effect of the string which was 2 mm in diameter and rough in texture.
Suggestions for further work
Repeating the measurements with different strings, including nylon
fishing line, would show whether the higher drag coefficient was
in fact due to the effect of the string.
It may be that if the surface of the ball were dimpled like a golf ball the wake would become narrower, reducing the drag force and drag coefficient. The drag coefficients for spherical balls with varying surfaces could be found, to determine at what point, distortion of the surface leads to reduction in drag. Dropping the balls in air over ten meters would provide an independent measurement of the drag coefficient in the 5 m/s velocity range.
Evaluation
The eight trials produced consistent results, but the motion was driven by hand, and it is possible that the data could been more accurate if a more regular method could be found to drive the motion, for example, a variable speed electric motor. It is also recommended that the range of orbital speeds be increased. The measured speeds covered a relatively small range (4-7 m/s) and the speed squared relationship has been verified only over this limited range.
There was some uncertainty in the scaling factor in Logger Pro when analyzing a video. The length of the string attached to the polystyrene ball was used as the scaling method. It was assumed that the string was horizontal throughout the motion, which was not strictly correct. An independent check could be made by placing a meter stick in the same plane as the polystyrene ball when recording the motion and by using a second camera to determine the angle of the string below the horizontal.