Tarang Kamarth and Cameron Gygi: 2007
Every year in France there is a car racing competition at Lemans.
The competition is not a Formula 1 race, but a competition between
European car companies. Highly endorsed companies like Mercedes
and Porsche gather engineers to come up with designs that will
give improved speed and efficiency. Since the 1980's engineers
have been finding that even a minor change in the design (shape)
of a car may decrease the drag, and for this reason, increase
the speed and efficiency of the car without adding weight or making
it difficult to drive. Research has shown the same effect with
airplanes. The SR-71 blackbird, the world's fastest jet, has a
point for a tail. The fuel efficiency of passenger aircraft has
been improved by bending the wing tips upwards to reduce turbulence.
Part 1
Research question
Is it possible to measure the drag on a small model car with simple
equipment, and to plot drag against velocity for different configurations?
Hypothesis
Drag in air is small and cannot easily be measured at low speeds.
For this reason it is proposed to move the car at constant velocities
through water and to measure drag forces in this situation. It
is expected that sufficiently accurate data can be obtained to
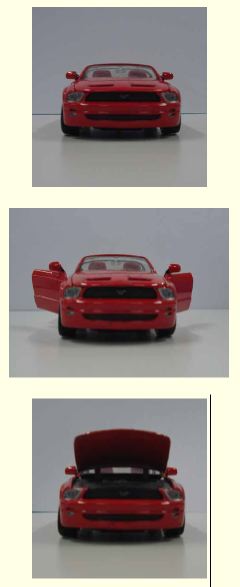
plot meaningful graphs when the car is in extreme configurations
(closed, with the doors open and with the hood up).
Procedure
A large perspex tube,
1.2 metes tall was filled with water. A pulley was then attached
to the side of the tube and angled properly above the water. A
miniature red mustang with a string tied to the front axle was
lowered using the pulley down to the bottom of the tube.
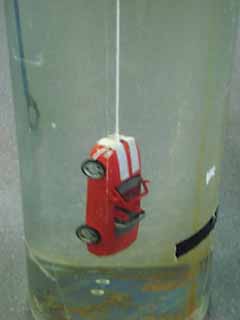
Fig 2 - the model car in water.
A wooden plank was placed inside the tube to prevent the car from changing position as it was dragged upwards. A force probe was attached to the string holding the car and to a hollow plastic ball. A motion detector (not shown) was placed on a table at the level of the ball. A person was able to put their hand inside the ball and pull it towards the motion detector in a straight line at constant speed. Then motion detector plotted the speed of the car on the ramp. The process was repeated for three different speeds, when the car was in three different configurations (closed, with the doors open, and with the hood up).
Care was taken to obtain data only when the car was moving at constant speed, to eliminate as far as possible inertial forces due to acceleration.
The weight of the car was 2.6 N. The drag force on the car at the difference velocities and in the different situations was measured by subtracting the weight of the car from the measured force The drag force was then plotted against the measure constant velocities.
Data
Average values for the constant measured force and constant velocity were found by taking the fluctuating values on the graphs and manually fitting an average line
Example
Table 1
The table lists the values of the constant measured force, drag force, and constant velocity, found by manually fitting lines to the graphs plotted for each situation. The measured drag forces are though to be uncertain by ±0.1 Newtons and the velocities by ±0.02 m/s. Multiple trials were not conducted at each velocity to determine the errors with more precision by averaging.
Analysis
The drag force in turbulent flow is expected to be proportional to velocity squared. The drag is plotted against velocity squared in Graph 1. Error bars are not shown on this graph but the data represents three apparently straight lines with increasing slope as the frontal area of the car is increased.
Discussion
Graph three shows that it is possible to collect sufficiently
accurate data to measure the drag on a car moving through water
and to show that the drag is proportional to velocity squared.
Before definitive statements can be made and the drag coefficient
can be accurately determined for each configuration and plotted
against frontal area more data is required.
Repeated trials at one velocity, in one configuration, would allow the errors to be quantified. More trials over a wider range of velocities for each configuration would allow the proportionality of drag and velocity squared to be established with more confidence.
In spite of these limitations, the preliminary data does establish
that drag can be measured, and that it increases with increasing
frontal area. It is widely held that fuel consumption for cars
on the open road is increased if the windows are open. There is
some evidence here that the belief may be true, because the increase
in drag with doors and hood open are five fold and eight fold
respectively (see graph 1).
Evaluation
Preliminary data has been obtained. In principle, drag measurements
can be made in water with a hand-held force probe. The data is
sufficiently accurate to distinguish clearly between three extreme
configurations.
The measurements could be repeated and extended under more carefully controlled conditions. The spherical reflector could be mounted on a cart and pulled along a table, to make it easier to move the car at a constant speed.
Data, with errors an order of magnitude smaller, would be required to detect the effects of smaller differences in the configuration of a car. In this case the movement could be motor driven. A variable speed electric motor would be required.
The frontal area of the car in the different configurations could be measured from photographs (by cutting photocopies and and weighing the parts, or otherwise) and the drag coefficients could be calculated.
Measurements made with a sphere and other well studied objects dragged through water are required to establish that drag coefficients calculated from data in water are applicable to drag at higher speeds in air.
Part 2