Priya Baskaran: 2005
Introduction
A capacitor is a device that stores energy or charge in an electrostatic field. Capacitance is the electric charge per unit potential difference across its plates.
The capacitance is given by....
... where Q is the charge and V is the voltage.
The more charge a device holds at a given potential difference, the larger is the capacitance.
The SI unit of capacitance is the Farad (F). Since the Farad is a large unit, capacitors commonly have their size expressed in µF (1 microfarad=10-6 F), nF (1 nanofarad=10-9 F) or pF (1 picofarad=10-12 F).
A simple model of a capacitor consists of two metal plates
separated by a non-conducting layer called the dielectric. The
dielectric may be air, plastic, waxed paper, mica etc.. When one
plate of a capacitor is charged using a battery or other source
of direct current, the other plate becomes charged with the opposite
sign; that is, positive if the original charge is negative, and
negative if the original charge is positive.
There are three factors affecting capacitance.
In this experiment, the dependant variable was the capacitance.
The independent variables were the plate separation and the material
between the parallel plates. The plate area was kept constant.
The distance between the plates was increased and the capacitance
data for that specific distance was found.
Research Question
What is the relationship between the capacitance and the separation of the parallel metal plates?
Hypothesis
The distance and the dielectric constant of the filling substance
will affect the capacitance. It is expected that as the distance
between the plates increases, the capacitance will decrease. It
is also expected that as the value of the dielectric constant
increases, the capacitance will increase.
Explanation
As the distance between plates increases, the region of space
where the electric field is stored will increase. As the
distance increases, the electric field remains constant. This
will increase the potential difference.
The potential difference is given by ...
... where d is the distance between the plates.
To keep the potential from increasing, charge must be removed
from the plates. Hence, the capacitance will decrease.
The dielectric constant of a material depends on its ability to
support electrostatic forces. The higher the dielectric constant,
the greater the ability of the dielectric to support electrostatic
forces, and hence the capacitance increases.
Procedure
The dimensions of the plates
were measured using a ruler. Two pieces of copper wire of length
30 cm were cut. One end of the each wire was connected to the
capacitance meter and the other end was taped to one of the plates.
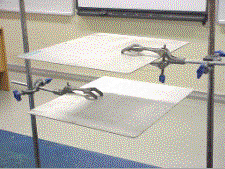
The apparatus what set up as shown in figure 1.
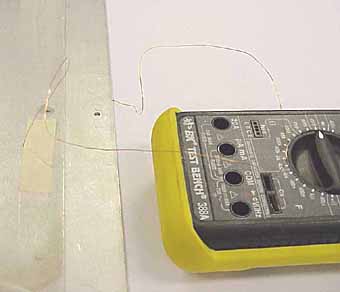 Fig 2 - the capacitance meter connected to the plates. |
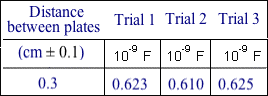
In the first part of the experiment, six sets of data of the capacitance (dielectric filling was paper) were collected, for three trials, as the distance between the plates was increased, by using stacks of paper (having larger dimensions than the plates). Between the plates, a stack of paper (having a height of 5 cm) was placed and the distance between the plates was measured by using a 30 cm (± 0.1) ruler. The knob in the capacitor meter was turned to 4n and the capacitance data was collected. After collecting the data for three trials for that particular distance, the knob was turned to Off. Similarly other five sets of capacitance data were collected, as the height of the stacks of paper was increased by 5 cm each time to 30 cm. The apparatus was set up as shown in figure 3.
In the second part of the experiment, six sets of data of the capacitance (dielectric filling was polystyrene) were collected, for three trials, as the distance between the plates was increased, by using pieces of polystyrene (roughly having the same length and the width of the plates). Between the plates, a piece of polystyrene was placed, the distance between the plates was measured by using a 30 cm (± 0.1) ruler and the capacitance data was collected. Similarly other five sets of capacitance data were collected, as the pieces of polystyrene was increased from 1-6. The apparatus was set up as shown in figure 4.
In the third part of the experiment, six sets of data of the capacitance (dielectric filling was air) were collected, for three trials, as the distance between the plates was increased, by using bungs and a two-sided tape (figure 5). Between each corner of the plates, a bung was placed, the distance between the plates was measured by using a 30 cm (± 0.1) ruler and the capacitance data was collected. Similarly other five sets of capacitance data were collected, as the number of bung at each corner was increased from 1-6 by stacking them using a two-sided tape. The apparatus was set up as shown in figure 6.
First Attempts
The first set of data for the capacitance of the paper filled capacitor was inconsistent (shown in Table 1) due to pressure not being applied on the whole plate equally. This affected the distribution of capacitance.
Table 1
In order to get consistent data, 5 kg weights were placed on top of the plate for the first and second part of the experiment. The weights were not used for the third part of the experiment (capacitance of air) for obvious reasons.
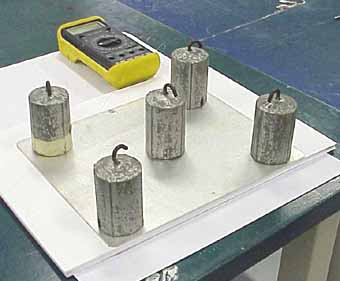 Fig 7 - weights in place on the top plate. |
Data
The Dimensions of the parallel plates were measured using a 30
cm ruler.
The capacitance data
is losted with plate separations for the three fillings; paper,
polystyrene and air, at right.
Analysis
The following graphs were made using Logger Pro..
Graph 1
Capacitance (Paper Dielectric filling) versus distance between
the plates
Graph 2 Capacitance (Polystyrene Dielectric filling) versus distance between the plates.
Graph 3 Capacitance (Air Dielectric filling) versus distance between the plates.
Discussion
In Graph 1, Graph 2 and Graph 3, as the distance increases, the
capacitance decreases. The relationship represented in the graphs
is not an exponential. The graphs show an inverse relationship.
The slope of the graphs is decreasing quickly, as the distance
between the plates increases. The equation of the graph is in
the form of. There is a constant A in the equation,
whose value is very small (due to the capacitor meter and the
wires) which affects the distribution of the capacitance. The
constant also causes the false zero in the graph. The additional
capacitance is not taken into account that resulted from fringing
of the electric lines of force beyond the space between the plates.
At the edges of the plates, there is fringing of the field as
it bows out into space (shown in Fig. 8). The charge
density is somewhat higher at the edges, and the charge can even
appear on the outer surface.
 Fig 8 - electric field in the plate region. |
The results support the hypothesis. The capacitance decreases
as the distance between the plates increases. Capacitance is inversely
proportional to the distance between the parallel plates.
Capacitance is given by ...
The relationship is valid. The charges on the parallel plates
create electrostatic lines of force. The lines of force are strongest
when the charged particles are close together, which refers to
the distance between the plates. When the charged particles are
further apart, the lines of force weaken and the ability to store
a charge decreases. A greater separation causes the charge on
one plate to exert less attractive force on the other plate.
For parallel plates, the value of epsilon is given by ...

.... where C is the capacitance, A is the area of the plates and d is the distance between the plates.
Graph 4 which shows the capacitance versus area/distance between plates is a linear graph. The slope is the value of epsilon for the material. According to the Graph 3, the dielectric constant of the materials (in decreasing order) is paper, air and polystyrene. Polystyrene has a lower dielectric constant than air probably due it being expanded (it was not dense polystyrene plastic). This result is surprising but it is quiet possible. The dielectric constant of a material depends on its ability to support electrostatic forces. The higher the dielectric constant, the greater the ability of the dielectric to support electrostatic forces.
The values of the distributed capacitance are given by the intercepts on the axis of Graph 4. As expected within errors the distributed capacitance (0.010 nf) is the same for the air and polystyrene fillings. The value is much higher (0.040 nf) for the paper filling, probably because the A3 paper was much larger than the plates. In future work this point could be clarified by cutting the paper to the size of the plates.
Evaluation
Problems arose while conducting this experiment. There was the wire contact problem. When the wires were touching each other, the capacitor meter gave the value 0L. The capacitor meter gave the value 0.002 when the wires were not connected properly to the meter. Each time this problem was encountered, the wires were removed and fixed properly to the capacitor meter. For the third part of the experiment, collecting the capacitance data for air was difficult. The bungs and a two sided tape were used to increase the distance between the plates which was an ineffective method. The bungs were not strong enough to hold the weight of the top plate. Next time, a clamp stand could be used, instead of bungs, to change the distance between the plates, as shown.