![]() Some of the energy
levels of the hydrogen atom are shown.
Some of the energy
levels of the hydrogen atom are shown.
Electrons are excited to the -0.85 eV level.
How many different photon frequencies will be observed in the emission spectrum involving just the energy levels shown?
a 3
b 4
c 5
d 6
![]() The
diagram represents the available energy levels of an atom.
The
diagram represents the available energy levels of an atom.
How many emission lines could result from electron transitions between these levels?
a 3
b 6
c 8
d 12
![]() The
diagram, which is drawn to scale, shows some of the atomic
energy levels of a fictitious element. The three transitions shown
result in radiation in the ultraviolet (UV), red and yellow regions
of the spectrum. Which one of the choices below correctly identifies
the transitions?
The
diagram, which is drawn to scale, shows some of the atomic
energy levels of a fictitious element. The three transitions shown
result in radiation in the ultraviolet (UV), red and yellow regions
of the spectrum. Which one of the choices below correctly identifies
the transitions?
| UV | Red | Yellow | |
| a |
|
|
|
| b |
|
|
|
| c |
|
|
|
| d |
|
|
|
![]() The
diagram shows five energy levels of the hydrogen atom.
The
diagram shows five energy levels of the hydrogen atom.
Which one of the electron transitions shown will give rise to a spectral line in the ultraviolet part of the electromagnetic spectrum? .....
a ... A.
b ... B.
c ... C.
d ... D.
![]() The diagram
at right shows four possible transitions between energy levels
in the hydrogen atom.
The diagram
at right shows four possible transitions between energy levels
in the hydrogen atom.
Which electron transition would be associated with the emission of a photon of the shortest wavelength?
a .... I
b .... II
c .... III
d .... IV
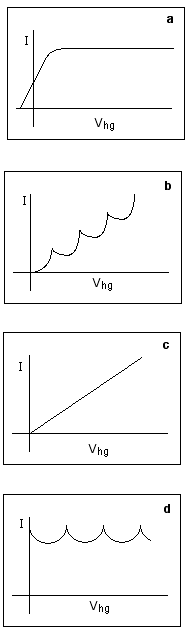
![]() The diagram
at right is a sketch of the apparatus used in the Franck-Hertz
experiment. Helium at low pressure is trapped in the container.
The values of anode current, I, were recorded for different values
of the potential difference between the heater and the grid Vhg.
The diagram
at right is a sketch of the apparatus used in the Franck-Hertz
experiment. Helium at low pressure is trapped in the container.
The values of anode current, I, were recorded for different values
of the potential difference between the heater and the grid Vhg.
Which of the graphs best represents the data obtained?
![]() The
diagram shows part of the energy level diagram of a certain
atom. The energy spacing between levels 1 and 2 is twice the spacing
between levels 2 and 3. When an electron makes a transition from
level 3 to level 2, the wavelength of the emitted radiation is l.
The
diagram shows part of the energy level diagram of a certain
atom. The energy spacing between levels 1 and 2 is twice the spacing
between levels 2 and 3. When an electron makes a transition from
level 3 to level 2, the wavelength of the emitted radiation is l.
What possible wavelengths of radiation can be produced by transitions between the three energy levels?
a Only l/2
b l/2 and l/3
c Only 2l
d 2l and 3l
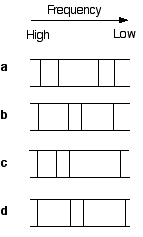
![]() The diagram
at right shows four possible energy levels of an atom and
four transitions between levels.
The diagram
at right shows four possible energy levels of an atom and
four transitions between levels.
Which one of the line frequency spectra below best corresponds to these electron transitions?