| This modern apparatus [$US342.00 ] repeats the measurements that served to establish the quantum nature of the absorption and emission of radiant energy. It effectively demonstrates that the energy of a photoelectron depends on the wavelength of the incident radiation and not the intensity, as would be expected if light behaved only as a wave. |
 |
A phototube is an evacuated glass envelope containing two electrodes. Light falls on the cathode (lower plate) made from an alkali metal, such as sodium. The clean sodium metal is bright and shiny. Most of the light reflects and heats the plate slightly, but otherwise nothing is expected to happen.
In fact, some of the light does not reflect, but passes energy to electrons that are ejected from the surface. Varying amounts of the available energy appear as heat, and some energy is required to free the electron from the metal surface. Some photoelectrons have more energy than others.
A reverse voltage (~1-2V) is applied to the tube. The voltage required to just stop the electron flow to the anode gives the maximum energy of the photoelectrons in electron Volts. Typical values obtained, when using this equipment with monochromatic light of different frequencies, are plotted on the graph at right.
Plotting the maximum electron energy, in electron Volts, as a function of the frequency of the radiation, f, gives a straight line.
The slope of the line is Planck's constant (h). The intercept on the vertical axis is defined as the work function (W); the energy needed to remove an electron from the metal surface.
Best results are obtained with a single frequency (monochromatic) light source, such as a mercury arc lamp used in conjunction with filters. If a monochromatic source is not available, filters and a tungsten lamp can be used, but the results are not as accurate, because the filters do not have a sharp high frequency cut-off and the stopping voltage is not clearly defined.
|
Exercise Plot the stopping voltage against the wavelength using the graph at right. Determine Planck's constant and the work function of the cathode material. |
This diagram from the web is a little more instructive than the standard text effort. The stopping voltage (blue meter) is increased until the photocurrent (red meter) drops to zero. A few volts are sufficient to stop all electrons even for the UV photons. The graphs show that the work function is lowest for Cesium.
Note: the Applet runs on the web. It is not a simulation, just an animated, reader operated, diagram.
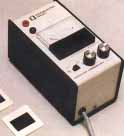
Several sets of the apparatus shown at right, were found in the department at ISB [2003]. They had not been used for some years. Jon Eales found three of the six sets to be still working.
Using room lights as a source with the filters supplied allows phototube operation with approximately monochromatic modulated (100 Hz) light. Using a cathode ray oscilloscope to measure the output voltage across a resistor (proportional to the photocurrent) gives the data shown.
Note: The room lights flicker. The line on the V-t plot on the oscilloscope goes flat when the photocurrent drops to zero. The stopping voltage is read from the dial when the AC component of the measured voltage is a minimum (near zero).
This particular phototube is not purpose built, and the filters do not give pure monochromatic light. The data points give a linear graph, which is correct in principle, but the values of Planck's constant and the work function found from the graph do not quite match the published values obtained elsewhere by more reliable means.
It is left as an exercise to find the work function in Joules and the value of Planck's constant from the graph.
A new, completely different method of finding Planck's constant has recently become available. Light emitting diodes have a threshold voltage below which they emit no photons. The purpose-built apparatus shown has five such diodes, with wavelengths as marked in nanometers. The threshold voltages, times the electronic charge, are plotted in Graph 2. The line is approximately straight. The value of Planck's constant is found to be of the right order of magnitude, but higher than expected by some 20%.
The light emitting diode method is not the original photocell demonstration. As electrons cross the barrier between the n-type and p-type semiconductors they give up barrier potential energy, which varies from 1-2 electron volts depending on the particular semiconducting materials used. Remarkably, in a few percent of cases, they give up this energy not as heat, but as a light photon. A determination of the barrier potential allows a direct determination of the photon energy in electron Volts (or Joules).
The blue diode (on which this demonstration depends) is a recent invention (~2000). For a brief discussion of diodes, including p-n junctions and LED's, click here.
|
Dan Baker asks ... "How does this happen? How does the energy lost as an electon crosses a p-n junction sometimes appear as a light photon, instead of a lattice vibration (heat)? It sounds very unlikely." I am not sure how to answer that queston. It seems also to me to be unlikely. Put it this way. If I didn't know that it happened, I would not expect it to happen. I am sure that the first person to see an ordinary p-n junction diode emitting light was astonished. I am also sure that it took most people some time to get used to the idea that when an elecron shell loses energy, a light photon is emitted. That is the way the world is. Why - at a deeper level - is another question. [Ed.] |