Precision and Accuracy
- Good science involves measuring a physical quantity a number of times.
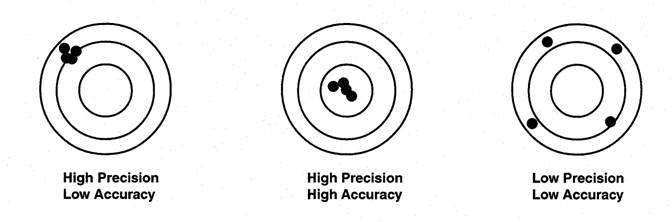
- We often use the terms precision and accuracy interchangeably when talking about an experimental result. Technically, they mean very different things. Remember this when writing lab reports.
Accuracy is an indication of how close a measurement is to the accepted value.
Precision is an indication of the agreement among a number of measurements made in the same way. Alternatively, precision is often used when referring to the resolution of a measuring instrument. We say that instruments that are scaled with small graduations are more precise than those with larger graduations.
Errors in Data
There are two types of errors that can occur when collecting data:
Systematic Error
A systematic error is an error that tends to be consistent for all measurements (built in). Reasons include:
- badly made instruments
- poorly calibrated (zero error)
- instrument parallax (reading a scale at an angle)
- limitations of experiment (e.g. not under standard conditions)
Systematic errors can often be minimized or corrected before the investigation is carried out. They should definitely be considered when discussing results. The best indication of a systematic error is a y-intercept value appearing on a data plot for the experiment. For this reason alone, never force a graph through the origin – you may be ignoring a significant error.
Random Errors
Random errors result from unpredictable variation in the performance of the instrument/operator or fluctuations in the physical environment.
- Random errors follow statistical distributions and can be minimized by:
- collecting enough data (multiple trials)
- well designed experiments (control of variables, consistency)
- using the most sensitive (precise) instruments
- On a graph, random errors show as the distribution of points around a best fit line. The more points on the line, the less random error.
- If measurements have a large uncertainty due to limitations in measurement techniques, it is expected that this will contribute to random error.
Variations and inconsistencies due to random error are relatively easy to spot by simply looking at the data. When discussing this type of error, ensure that it is supported by the data and that a realistic improvement for minimizing its effect is mentioned.
Comparing Values in Science
It is very common in science to use lab results to obtain a final value that is compared to an accepted value found in the literature. These comparisons are an indication of the accuracy of the experimental value because they compare an experimental value to the accepted actual value.
The percent error is calculated by:

So as not to confuse it with relative (percentage) uncertainty, we will always use percentage error to refer to the accuracy of an experimental result. Relative uncertainly will always be the uncertainty inherent in a given measurement/data point, expressed as a percentage.