Analysis
Statistical Tests of Significance
Types of Statistical Tests of Significance (Used in Biological Sciences)
Introduction
When you compare two groups of data you need to determine whether or not there is a significant difference between them.
For example, if you collected data that includes an experimental group as well as a control group you will want to compare that data to see if your independent variable has made a meaningful difference. You will probably always find differences in the two data sets but the important step is to decide if the differences you see are significant. You can also test between two groups, for example blood pressure in males versus females.
An effective presentation of the data goes a long way to assessing whether or not a trend is emerging. This is, however, not the same as using statistics to assess the nature of such a trend and whether it is significant, in other words, whether a trend, judged subjectively from a graph, is actually valid.
When analysing your data, you should:
- use a statistical test to assess the data,
- briefly explain your choice of test,
- show that the data meets the criteria for the test (e.g. for a t-test demonstrate th the data are normally distributed)
- outline the working hypothesis
- put the results of the test into the context of your investigation.
For statistical tests the correct protocol should be presented, including
- null and alternative hypotheses,
- degrees of freedom,
- critical values
- p-values (probability levels).
Null Hypothesis
You are essentially comparing two sets of data by means of a concept called the “Null Hypothesis”. The Null Hypothesis (H0) states that your two data sets (and the differences you see) are NOT significantly different. There are several ways to test these differences including:
- comparing the means and standard deviations of the sets;
- doing a t-test;
- doing a Chi Square test.
There are others tests as well, but they are not covered here.
The Null Hypothesis (H0) looks like this:
Experimental Data Set = Controlled Data Set
You are saying that there are NO DIFFERENCES between the two sets of data. This is called the Null Hypothesis. You may use any of the tests shown above: Standard Deviation, t-test or Chi-Square to see if the Null Hypothesis is true. We test so that we can state whether the Null Hypothesis is “accepted” or “not accepted”. In either case you have learned something!
Vocabulary and concepts for statistical tests
In order to understand what these tests show you it is important to be familiar with some terms and ideas such as significance, significance level, critical value, P-value, and degrees of freedom.
Significance
A significant difference is one that is not likely to be caused by chance. In science, 5% (P = 0.05) is usually chosen as the boundary between differences that are significant and differences that are not significant.
A value of P = 0.05 means that 5% of the time the differences you see could be due to chance alone. GraphPad uses 5% as its significance level, but you can choose different levels (10%, 1%, etc.) according to your needs.
P-value
The P value tells you the chance of getting your results by chance. As, we’ve said, the border for significance is usually set at 5%. Any P-value greater than your significance level (usually 0.05) indicates that the difference between your data sets is not significant. A P-value less than (or equal to) your significance level means that the difference is significant. When you complete your calculations, the precise value of “P” for your data will be shown.
Example: P= 0.07, Significance level 0.05
0.07 > 0.05, therefore difference is not significant
Critical Value
The critical value is a step along the way to figuring out the P-value. Most of the time you will not need to worry about the critical value because GraphPad (and other online calculators) will determine the P-value for you. When a statistical test is done, you get a number (your statistic). That number means a particular P-value. For example, 3.841 is the critical value for P = 0.05 in a Chi-square test (with one degree of freedom –see below).
Tables are available for each test that show the critical values for different levels of significance and degrees of freedom. You can compare your number with the critical value. If your number is bigger than the critical value, the difference between data sets is not significant. If your number is smaller than or equal to the critical value is significant.
Degrees of freedom
If you need to use a table to determine the critical value for your P-value, you will need to know the degrees of freedom.
t-test: Degrees of freedom = total number of data points – 2. For example, you measure the height of 20 seedlings with fertilizer and 20 without. You have 40 total data points, so you have 38 degrees of freedom.
Chi-square (goodness-of-fit test): Degrees of freedom = number of categories – 1. For example, you want to know if a six-sided die lands equally on all six sides, so you roll it many times and count how many times each number comes up. You have 6 categories, one for each of the possible numbers rolled, so you have 5 degrees of freedom.
Comparing Means
Comparing data (testing the Null Hypothesis) for which a mean (average) can be calculated can be done using standard deviations or the t-test.
Standard Deviation
The standard deviation is the spread of the data around the mean. The larger the standard deviation the wider the spread of data is.
Standard deviation is used for normally distributed data. This makes it useful for showing the general variation/uncertainty around a point on a line graph, but it is less helpful for identifying potential anomalies.
The standard deviation method is quick and easy to use. Simply compute the mean and standard deviation (easily done with a graphing calculator – see your teacher for help) for each group. Standard deviation is used to see how widely the data is spread above and below the mean. As a note: this tool is not considered to be reliable if you have fewer than 10 data points in each group.
CLEAR DIFFERENCES
There are 2 basic observations to look for that give CLEAR results.
A) Is the difference between the two means LARGER than either standard deviation?
Or
B) Is the difference between the two means SMALLER than either standard deviation?
In case “A” you will report that the difference found between the means IS significant and that the control group and the experimental group show true differences. In other words, your independent variable did make a difference! Something DID happen in your groups and there is not an overlap of data. The Null Hypothesis is NOT accepted.
In case “B” you will report that the difference found between the means IS NOT significant and that the differences between the control group and experimental group do not show true differences. In this case your independent variable DID NOT make a difference. Nothing happened of significance – your data overlaps and the two groups are too similar to draw a conclusion. The Null Hypothesis IS accepted.
NOTE: Even if you get a clear difference, you may wish to do a t-test because it can provide additional information and further support your analysis of the data.
A Sample Study
Cedar-apple rust is a (non-fatal) disease that affects apple trees. Its most obvious symptom is rust-colored spots on apple leaves. Red cedar trees are the immediate source of the fungus that infects the apple trees. If you could remove all red cedar trees within a few miles of the orchard, you might eliminate the problem. Two groves of apple trees were studied. In one grove, the experimental group, all red cedar trees within 100 yards of the orchard were removed. In the other grove, the control group, red cedar trees were allowed to stay near the orchard. The number of “rusted” leaves were counted on the trees in each grove. The results are recorded below:
Table 1: Number of rusted leaves counted per tree in two groups.
Tree Number |
Control Group |
Experimental Group |
1 |
38 |
32 |
2 |
10 |
16 |
3 |
84 |
57 |
4 |
36 |
28 |
5 |
50 |
55 |
6 |
35 |
12 |
7 |
73 |
61 |
8 |
48 |
29 |
9 |
57 |
37 |
10 |
35 |
41 |
Mean |
46.6 |
36.8 |
Standard Deviation |
21.1 |
16.8 |
Now we should test the Null Hypothesis for this experiment. The Null Hypothesis states:
Experimental Data Set = Controlled Data Set
Using the criteria above, it is clear that the difference between the means of the two groups (46.6 – 36.8 = 9.8) is SMALLER than either of the 2 standard deviations (21.1 and 16.8). Therefore, it can be concluded that there is no significant difference between the data found in the control group versus the experimental group. The Null Hypothesis is accepted.
This study was adapted from information found at: http://www.physics.csbsju.edu/stats/t-test.html
UNCLEAR DIFFERENCES
But, what if the test above is really close? Or what if the difference in means is larger than one standard deviation and not the other? In this case you will need a more sophisticated test and this test is known as the “t-test”.
Back to Top
The t-test
The t-test uses a complex formula to test if the difference between two means is significant. The t-test basically compares the data sets using the mean and standard deviation. Also included as part of the proof is the number of data points in each set. Again, this test is not valid if fewer than 10 data points are used in each set. The more data the more reliable the conclusion.
The t-test is also not valid if the sets of data are not 'normally distributed', in a statistical sense. Therefore, before using the t-test, it isrequired that you conduct a "Test for Normality". There is a formula for calculating the normality of a data set, but there are websites that will do it for you. Here is one we recommend: http://sdittami.altervista.org/shapirotest/ShapiroTest.html . You just type or paste in your data set, and it will tell you if it is 'normal' or not.
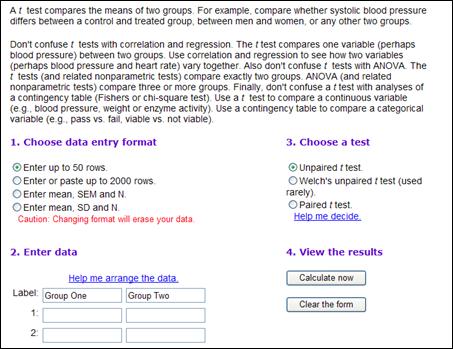
After you've shown that your data set is normally distributed, you have to do a t-test for differences of means. This requires use of a very complicated formula, but luckily there are sites on the internet that you can go to that will perform a t-test if you enter your data into their calculator. One of the most popular can be found at http://www.graphpad.com
Data can be entered at graphpad.com by selecting their “quick calcs” on the opening page.

Then click on the link for “continuous data”.

Next click on “t-test to compare two means”; then click on “continue”
Now choose following the steps on the page. (We almost always use the unpaired t-test*) Enter your data. Click “Calculate Now” when data is entered. Read your results!
*Paired t-test: You should use a “paired t-test” when you are measuring the same individuals but at different times. For example, you might treat plants with fertilizer and measure their heights before and after. In this case a paired t-test is required.
Here is what the data would look like for the sample study about cedar-apple rust.
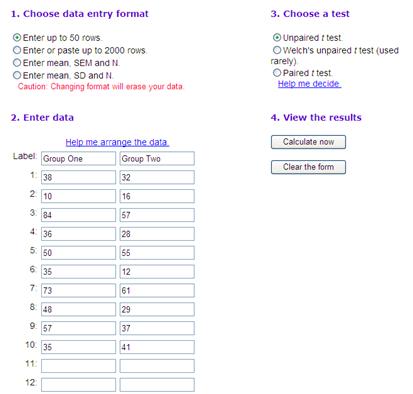
Here are the t-test results from GraphPad for the cedar-apple rust study.
You already suspected that the data was not significant because the difference between the means was smaller than the standard deviations. Now you have statistical support for your conclusion.
You also have the P-value (P = 0.2662) which tells you that you would expect to find a difference of this size due to chance alone 26.62% of the time. This is not even close to the chosen significance level of P = 0.05
Tip: It is usually easier to just perform a t-test of data using the graphpad.com website (compared to using your calculator to compute means and standard deviations) as GraphPad will calculate the means and standard deviations as well as telling you if the differences are significant or not.
If the differences ARE significant you need to write a statement like this in your conclusion:
“A t-test was performed using the site http://www.graphpad.com. Based on ___ degrees of freedom and a P value of ____ the Null Hypothesis is not accepted. The differences between the control group and the experimental group are significant.”
If the differences ARE NOT significant you need to write a statement like this in your conclusion:
“A t-test was performed using the site http://www.graphpad.com. Based on ___ degrees of freedom and a P value of ____ the Null Hypothesis is accepted. The differences between the control group and the experimental group are not significant.”
Back to Top
Chi-square (Χ2) test:
The chi-square test is used when the data falls into different categories. It can actually be used in different ways, but we usually use it as a “goodness of fit” test, so the following information is only for goodness-of-fit.
Chi-square will tell us if the frequency in each category matches what we expect (your null hypothesis). To use chi-square, the expected frequency of each category should be at least 5.
The expected frequency is the value (number of pieces of data) you expect to find in each category. You must know the sum of all the pieces of data from all categories. You must also know what the null hypothesis is. Based on your hypothesis and the total pieces of the data that you have, how many pieces of data do you expect to be in each category? This might not be a round number, but that is OK.
You can NOT use percents for Chi-square, because the actual number of data points is very important to the results. Percent is always based on 100 data points.
Example
Let’s say you have a six-sided die, and you roll it 75 times. The null hypothesis is that all six sides have an equal chance of coming up. Therefore, you would expect equal values for each category (each number on the die). If you roll a six-sided die 75 times, you would expect to roll a “1” 12.5 times. You would also expect to roll the other numbers (2, 3, etc.) 12.5 times each. Even though it’s not possible to roll a number 12.5 times, it is still the expected frequency. Do NOT round it off.
Once you complete the chi-square calculation, you will want to write about the results.
If the differences ARE significant you need to write a statement like this in your conclusion:
“A chi-square test was performed using the site http://www.graphpad.com. Based on ___ degrees of freedom and a P value of ____ the Null Hypothesis is not accepted. The differences between the control group and the experimental group are significant.”
If the differences ARE NOT significant you need to write a statement like this in your conclusion:
“A chi-square test was performed using the site http://www.graphpad.com. Based on ___ degrees of freedom and a P value of ____ the Null Hypothesis is accepted. The differences between the control group and the experimental group are not significant.”
A sample study
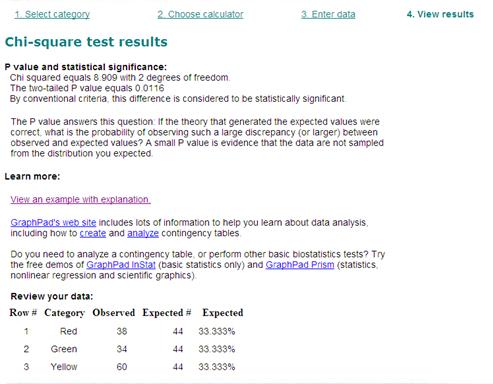
A farmer grows three kinds of apples (Red, Green, and Yellow). He wants to know if the hawthorn beetle, which infests apples, prefers to lay its eggs on one kind of apple rather the others. During apple season, the number of eggs laid on a controlled sample group of each type of apple was counted.
The null hypothesis is that the beetle lays its eggs on all apple types evenly.
|
Type of Apple |
Red |
Green |
Yellow |
Number of beetle eggs |
38 |
34 |
60 |
Follow the links on GraphPad to Categorical Data calculators.
Choose Chi-square and continue.
Enter your data and the expected values in the space provided.
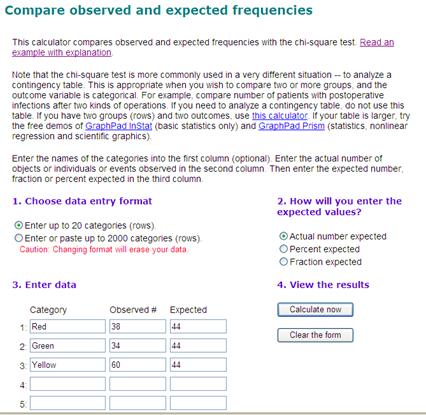
Check your results.
In this case, the data represents a significant difference. There is a 1.16% chance (P = 0.0116) that the difference between categories would occur due to chance.
Back to Top
Back to Analysis