Sample Data Tables
1. Some examples of tables for quantitative data (but they can be improved!):
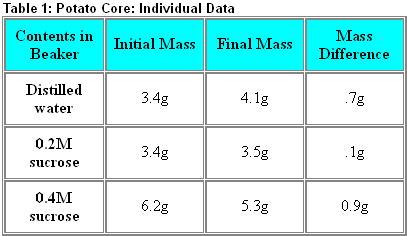
What would make this table better? Did you notice that the "g" should NOT be with the numbers within the table? Put it in the heading above the column like this: Initial Mass (g). Also, the data should be presented consistently. The last column should be 0.7, 0.1, 0.9. Finally, if appropriate, the uncertainty in the mass measurements should be included in the column headings like this: Initial Mass (g) (± 0.1g).
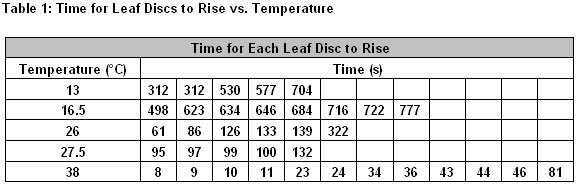
Do you see how Jennifer placed her units at the column headings? She also included a title for her table that gave a brief description of the contents. She should have been consistent with the significant figures of her temperature readings ... 13.0, 16.5, 26.0 ... Also, the uncertainty in temperature and time could have been included. A column showing average time might have also been included. (Our thanks to Jennifer Chen, ISB student, for allowing us to use this table.)
2. An example of a good data table for quantitative data:
Table 1: Cart Acceleration from Different HeightsHeight |
Acceleration (m/s/s) (+/- 0.03) |
|||
Trial 1 |
Trial 2 |
Trial 3 |
Average |
|
6.2 |
0.25 |
0.27 |
0.21 |
0.24 |
12.4 |
0.50 |
0.48 |
0.49 |
0.49 |
20.5 |
0.84 |
0.84 |
0.85 |
0.84 |
27.0 |
1.10 |
1.09 |
1.13 |
1.10 |
This table has all the characteristics of a good data table. It is labeled and titled, column headings include the quantity, units, and uncertainty. Also, the data values are rounded consistently to match the uncertainty. (Our thanks to Advi Bishnoi, ISB student, for this table.)
3. A good data table for qualitative data (but it can be improved!):

What would make this better? Perhaps a key explaining the meaning of the "+" and "-" signs is needed? Was the amber color in the beaker clear, cloudy, pale, dark, etc.?
4. A very good table for qualitative data:
 ß
ß